![]()
![]()
This topic describes how to create and save hypothetical illustrations for your clients. The following areas are covered:
Assigning fees to be charged for purchasing the funds and/or managing the portfolio
Determining the tax rate to apply to the portfolio or securities
Selecting reports you want to include (and making any changes to the report options that are available)
Updating the default settings for hypothetical illustrations.
Although you can create hypothetical illustrations for individual securities, or to compare securities (e.g., mutual fund vs. mutual fund, or mutual fund vs. ETF), this topic will illustrate how to create a hypothetical illustration for a client’s portfolio.
Note: The chief difference between creating a hypothetical illustration for individual securities or a comparison vs. that for a portfolio is that you can rebalance securities only in a portfolio.
In this case, the sample portfolio will be for changing the investments in a traditional IRA worth $200,000 (using the earliest common time period for all holdings). The scenario also includes making subsequent annual investments. The portfolio will be rebalanced semiannually, and a 1% management fee will be applied. No taxes will be taken out.
The most direct way to launch the hypothetical illustration tool is to go to the menu bar and select Tools, Hypothetical Illustration.
The tool can also be launched from the Portfolio Management, Accounts area. Simply place a check next to the account and select Action, Create Hypothetical Illustration from account. The advantage to selecting the tool from this area is the investments tied to this account are automatically loaded into the hypothetical illustration.
In this section, you’ll learn how to select investments for a hypothetical illustration. Note the following about creating a hypothetical illustration and searching for securities:
You can include up to 40 securities in an illustration.
You can search for more than one security at a time (see the Note below), but you can search for items by name or ticker from only one security universe (mutual funds, stocks, ETFs, etc.) at a time.
When searching on a portion of a security’s name, you must enter at least four characters.
To create a hypothetical illustration and select investments for it, do the following:
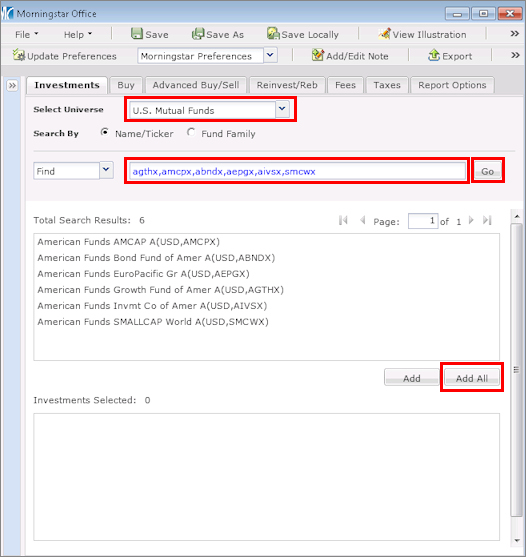
On the Investments tab, use the Universe drop-down field in the upper left corner to choose the type of investments you want to search for. For this example, we’ll use the default option, U.S. Mutual Funds.
You can search for items by Name or Ticker symbol by entering those values in the search field. When you look for an item, the system searches for it by ticker symbol, name begins with, and name contains. Here, enter the following ticker symbols: agthx,amcpx,abndx,aepgx,aivsx,smcwx.
Note: Separating items with a comma (agthx, contrafund) uses an OR methodology: find agthx OR contrafund. Separating items with a space (muni ca) uses an AND methodology: find funds that have “muni” and “ca” in the name.
Click Go. The investments you searched for appear in the Total Results box.
Confirm that the items are the ones you searched for, then click Add All. The investments now appear in the Final Results box.
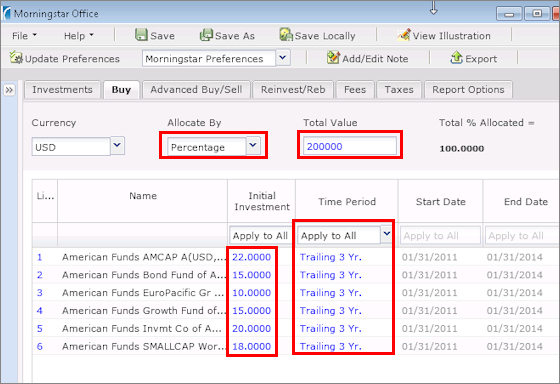
Click the Buy tab at the top of the window.
On the Buy tab, the default value for each fund’s Initial Investment is $10,000, and the default time period is for the trailing one-year period. Note that you can use the dropdown fields at the top of this tab to manipulate the following:
Currency (depending on which currencies your institution has decided to include)
Method of inputting the value (dollars, shares or percentage)
Total Value invested for the illustration (if entering allocations by percentage), and
Time Period for the illustration.
Do the following on the Buy tab:
Make sure the Currency field is USD.
From the Allocate By drop-down field, select Percentage.
In the Total Value field, type 200,000.
In the Initial Investment fields, enter the following values:
|
Investment |
Percentage Amount |
|
American Funds Amcap A |
22 |
|
American Funds Bond Fund of Amer A |
15 |
|
American Funds EuroPacific Gr A |
10 |
|
American Funds Grth Fund of Amer A |
15 |
|
American Funds Invmt Co of Amer A |
20 |
|
American Funds Smallcap World A |
18 |
To set the Time Period for the hypothetical illustration, click the Time Period drop-down field in the Apply to All row and choose Trailing 3 Yr. All other rows will automatically use this start date.
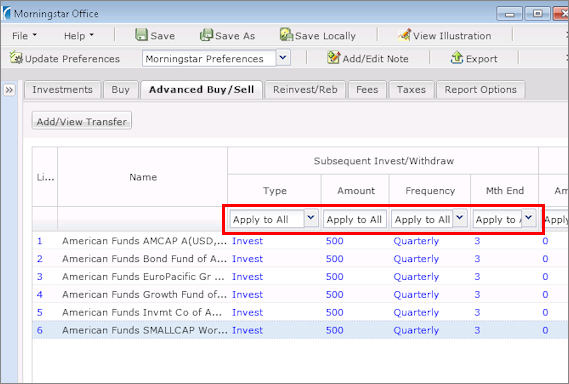
Click the Advanced Buy/Sell tab at the top of the window.
On the Advanced Buy/Sell tab, we’ll indicate that in addition to the starting amount of $200,000, the client will also invest an additional $500 in each fund every quarter. In the Subsequent Invest/Withdraw area, do the following in the Apply to All row:
Note: Alternatively, you could enter different values in each row for the securities.
In the Type field, confirm that Invest is selected.
In the Amount field, click where it says Apply to All and type 500.
From the Frequency field, select Quarterly.
From the Month End field, select 3. This means the contribution will be made at the end of the third month of the quarter.
What if I need to make a withdrawal?
To make regular withdrawals from a hypothetical illustration, select Withdraw or Withdraw % from the Type field in the Apply to All row.
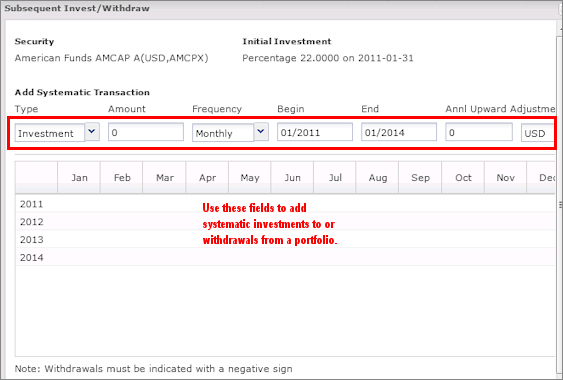
By default, the system will begin to make these subsequent investments or withdrawals based on the Start Date you entered. If you want to illustrate delaying the contribution (or withdrawal) for a period of time, do the following from the individual investment’s row:
From the Type field, select Custom. A new window appears.
You can either use the Add Systematic Transaction fields, and alter the Begin date and End date as necessary, or you can type the value to be invested or withdrawn directly into a monthly field. Note that investments are entered as positive numbers, and withdrawals are entered as negative numbers.
What if I want to transfer assets between investments?
Although we will not use this in our scenario, it is possible to transfer assets from one investment to another. One scenario in which you might want to do this is to allocate a majority of assets first to a fixed-income fund, and then gradually move money to an equity fund. This dollar-cost averaging process might appease conservative investors who are leery of putting a large sum of money into a stock fund all at once.
To transfer assets from one investment to another, do the following:
From the Advanced Buy/Sell tab, click the Add/View Transfer button. The Transfer dialog box appears.
![]()
Click in the From field and select the investment you want to move money from on the drop-down list.
Click in the To field and select the investment you want to move money to on the drop-down list.
Fill in the remaining fields with the amount of money you want to move (by dollars or percentage), how often the money should be transferred, and when the transfer should begin and end. Note: Use the scroll bar to see additional fields.
If necessary, click in the next row to add an additional transfer scenario.
The next step is to rebalance the portfolio, to ensure the assets remain in their proper allocation.
Note: Remember that rebalancing a portfolio will incur loads and redemption fees, unless you elect to exclude these on the Fees tab.
To rebalance a hypothetical illustration, do the following:
Click the Reinvest/Reb tab at the top of the window.
From the Rebalance Frequency drop-down field at the top of this step, choose Semi-Annually.
You can set a new rebalancing schedule for the funds if you like, or you can use the initial investment allocation.
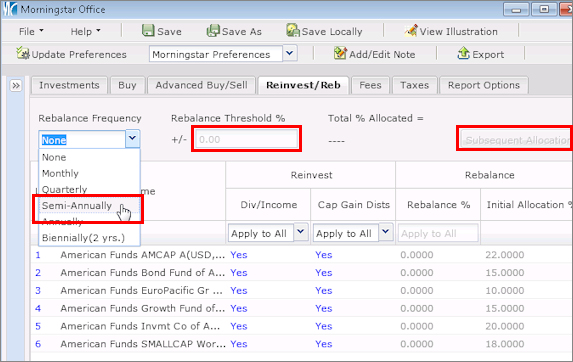
To enter a threshold the portfolio must reach before rebalancing occurs, click in the Rebalance Threshold % +/- field and enter a percentage.
To rebalance to different asset allocations over time, click the Subsequent Allocations button. The Subsequent Allocations dialog box appears.
From the Allocation Update Frequency drop-down field, select Annually.
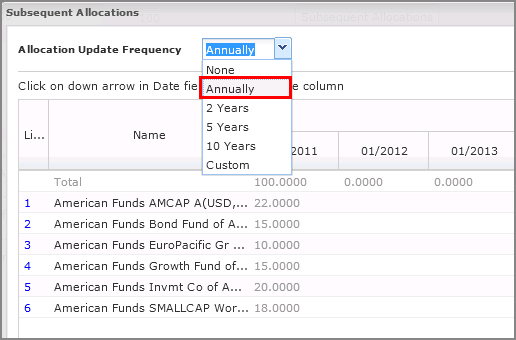
Note: You can select Custom from the Allocation Update Frequency drop-down list to enter up to 15 allocations with custom dates. You must use month-end dates.
In the fields below, you can enter new allocation values.
Click OK to return to the Reinvest/Rebalance tab.
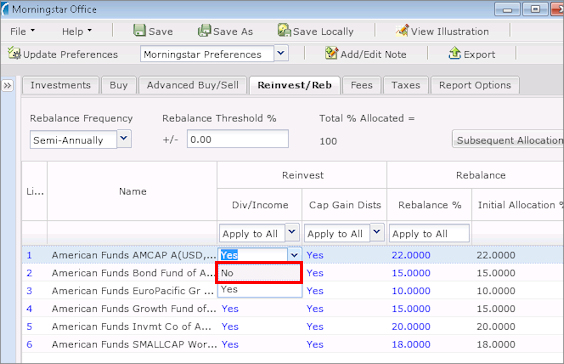
The other aspect of the rebalance step is to decide whether dividends and capital gains will be reinvested in this portfolio. The default option is to reinvest these monies, and we will leave this setting as is. If the client did not want to reinvest the dividends and capital gains, and instead wanted to take them as distributions, you could select No from the drop-down field for each of those columns.
Here are some factors to consider when determining the fees for a hypothetical illustration:
Will the fees be paid by selling off shares from the portfolio, or will the client pay the fees our of their own pocket?
Will the fees be paid at the beginning of a time period, or at the end of one?
If the fees are to be paid by selling off shares of the portfolio, should the cash position be used before equity or fixed-income holdings are used?
If you elected to rebalance the portfolio, are you going to apply transaction fees for the rebalancing?
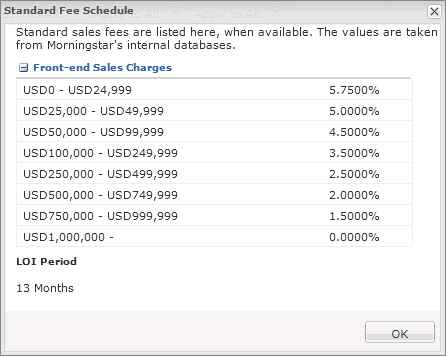
Are you going to use the Standard front-end loads for the funds, or enter a custom charge?
Is there a Letter of Intent for future purchases to consider?
Note: To see the front-end sales charges and LOI period for a fund, scroll to the right on the Fees tab and click the View link in the Standard Fee Schedule column.
To set the fees for the portfolio, do the following:
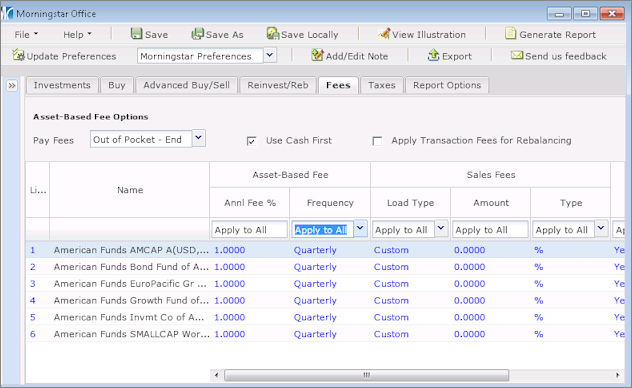
Click the Fees tab at the top of the window. Since we’ll be using the same rate for each fund, you can enter all of the following values in the Apply to All row.
In the Annl Fee % field, type 1.00.
From the Frequency field, click the drop-down arrow and select Quarterly. (This means that each quarter, 25 basis points will be applied to the portfolio to determine what fees will be charged for managing the portfolio.).
To avoid charging both an annual fee and the load for a fund, click the Load Type drop-down field, select Custom and ensure the Amount field is 0.
To assign the tax rate for the hypothetical illustration, do the following:
Note: Illustrations that contain subaccounts for a variable annuity will not be able to apply taxes.
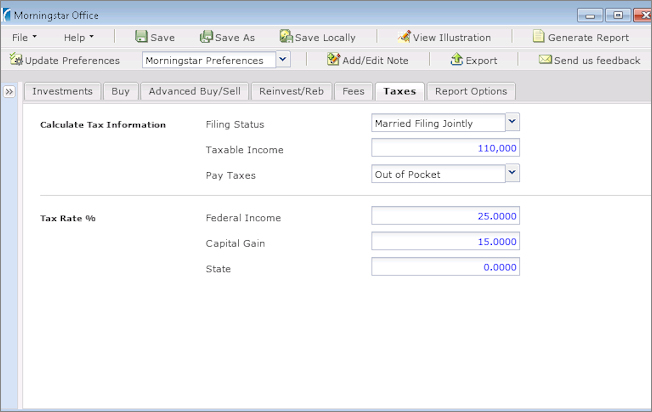
Click the Taxes tab at the top of the window.
From the Filing Status drop-down field, select Married Filing Jointly.
In the Taxable Income field, type 110,000.
Click anywhere on the screen. Note that the Federal Income field automatically updates with the correct value. You can overwrite this value, or any of the other tax fields, if necessary.
The final tab in the hypothetical illustration tool requires the following decisions:
What type of hypothetical illustration are you going to run: Individual Holdings, Portfolio or Comparison?
What reports will you include along with the hypothetical illustration?
How frequently will returns be displayed for the hypothetical illustration?
To set the report options, do the following:
Click the Report Options tab at the top of the window.
From the Report Type area, make sure the Portfolio option button is selected.
In the cover page area, fill in the fields for Client Name and Prepared By.
Click the check box for each report you would like to include along with the hypothetical illustration. Each report is briefly described in the table below.
The reports you see in your version of the application will be those your institution has subscribed to. They might differ from those listed below.
|
Report Name |
Description |
|
Distribution and Withdrawal Summary |
This report shows you the dividends, capital gain distributions and withdrawals that were either taken from or reinvested back into investments over the hypothetical period. |
|
Portfolio X-Ray* |
This report details a portfolio’s holdings in terms of broad asset class exposure, style box breakdown by Equity and Fixed-Income holdings, and regional exposure. |
|
Portfolio Snapshot* |
This report shows both holdings and performance information for a portfolio of investments. |
|
Stock Intersection* |
This report shows you the overlap for the top 25 net stock holdings in a portfolio, ranked by percentage of portfolio net assets. |
|
Risk/Reward Scatterplot** |
The report shows the standard deviation and mean return for each holding, as well as the portfolio itself, and the benchmark. In contrast to the Risk/Reward Scatterplot on the Portfolio Snapshot report, this version provides a numbered and color-coded key to understand which dot on the scatterplot reflects each holding. |
|
Correlation Matrix** |
This report demonstrates the relationship of return patterns among investments. If a strong positive correlation is present among all holdings, you might not be getting true diversification for the portfolio. Up to 20 holdings can be shown here. |
|
Rolling Returns** |
This report shows the returns for each holding in the illustration, and it reflects the time period for the illustration as well. The largest positive and negative return period is shaded gray on the chart. |
|
Total Annual Return |
This report shows the total return (after fees and expenses) for the trailing 12 months for each holding. Up to 10 securities (selected based on alphabetical order) can be displayed. |
|
Investment Details |
This one-page report summarizes the information for each investment in the portfolio. |
|
Price and Distribution Report |
This report shows you the change in NAV for a fund going back to its inception date (or the earliest price available in Morningstar’s database. You can also see the dividend and capital gain distributions for a fund on this report. |
|
Disclosure Materials |
This material must be included in order for the illustration to be FINRA compliant. |
*These reports are available only when you run a Portfolio hypothetical. They are not available for Individual Holdings or Comparison hypothetical illustrations.
**You need to select the time period (available at the bottom of the Report Option tab) to be used with these reports.
From the Display Return on Report field, select Semi-Annually. This will allow us to see returns every six months for the portfolio.
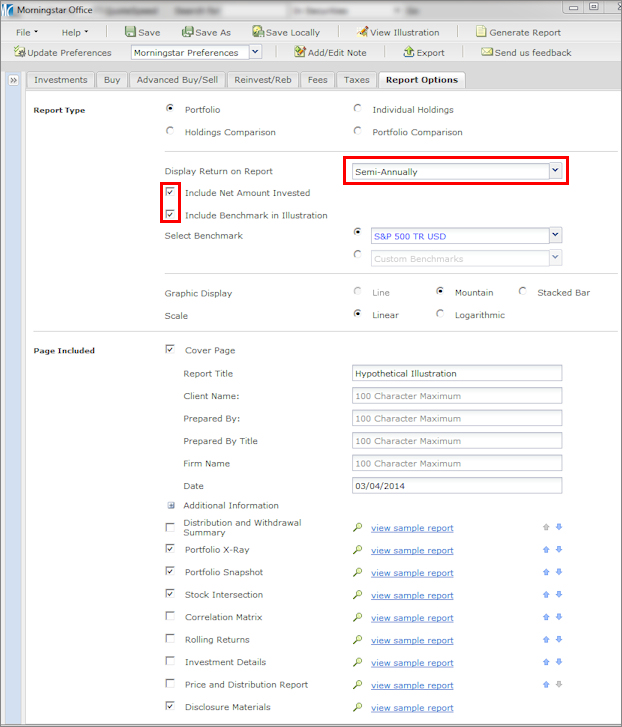
Leave the boxes checked for Include Net Amount Invested and Include Benchmark. The default benchmark is the S&P 500 Total Return index, but you can change this. The Include Net Amount Invested field will include a third line on the Portfolio Summary hypothetical illustration chart. The first line shows the performance of the hypothetical, the second shows the performance of the benchmark, and the third is the total number of dollars the client has invested over time.
Note: if you did not make any subsequent investments in the hypothetical, it is not necessary to check the Net Amount Invested box, because this will simply produce a flat line on the hypothetical return graph at the amount of the initial investment.
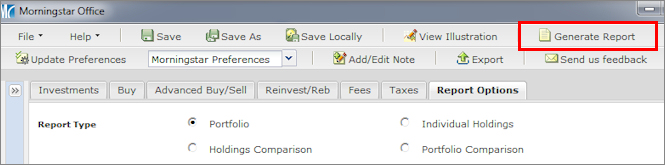
Now that all of the variables for the illustration have been entered, click the Generate Report button at the top of the window. The reports will appear as a PDF in a separate window.
You can save a hypothetical illustration at any point as you are creating it. Once saved, a file can be reused as is, or edited to reflect updated information. To open an existing hypothetical, go to File, Open and then click the Find button to see a list of all previously saved files.
To save a hypothetical illustration, do the following:
Click the Save or Save As button (if you are altering an existing hypothetical) at the top of the screen. The Save dialog box appears.
Type a name for the hypothetical illustration, and then click OK.
If you would prefer to save the illustration locally in an encrypted XML file, click the Save Locally button instead. You will be prompted to choose a name and destination for the file.
If you find yourself using the same inputs (initial investment, time horizon, rebalancing, fees, etc.) for a hypothetical illustration over and over again, you can save those settings as your default options.
To update the default settings for a hypothetical illustration, do the following:
With the hypothetical window open, click the Update Preferences button to open the Preferences dialog box.
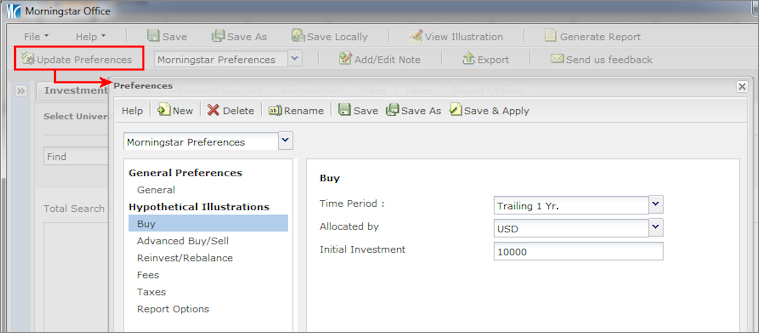
At the top of the window, click New. The Save dialog box appears.
Type a Name for this set of preferences, then click OK.
Under Hypothetical Illustrations, select a main area (Buy, Advanced Buy/Sell etc.) from the left-hand navigation panel, then update the default preferences for each area.
Click Save to save your preferences.
To select your set of preferences while working in the hypothetical illustration tool, click the Preference drop-down field at the top of the window and make a selection.